


Blog Overview
I started blogging again in July 2023 after some shifting of my job responsibilities, and my children growing up which gave me a lot more discretionary time. I do this for me, but I hope some others find my posts interesting or useful in some way.This is Why I Am Concerned About the Stock Market
9/30/2024 by Alan
Post Content, Images & Videos
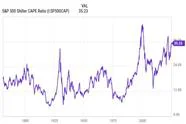
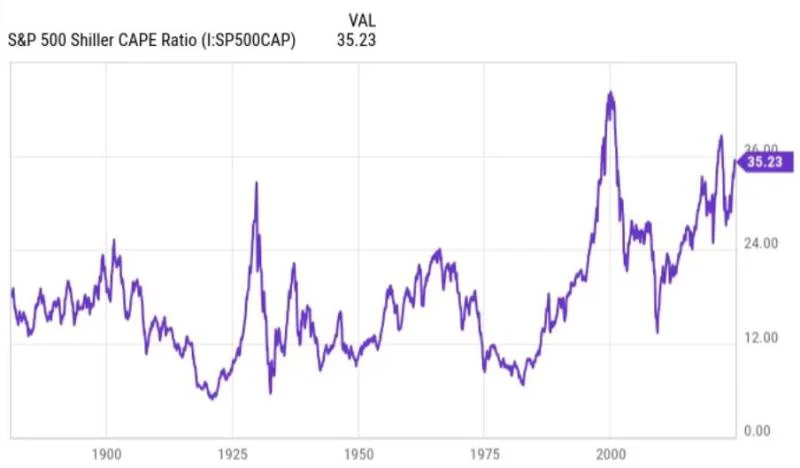
Shiller CAPE Ratio
The P/E ratio is probably the most well-known investing metric. It divides a company's share price into its trailing-12-month (TTM) earnings per share (EPS) to come up with a figure that can be compared to its peers, the broader market, and history to determine if a company is relatively cheap or pricey.
Meanwhile, the Shiller P/E ratio is based on average inflation-adjusted EPS over the previous 10 years. The advantage of looking at 10 years of inflation-adjusted EPS data as opposed to TTM EPS is that it smooths out shock events (e.g., the COVID-19 pandemic) that can easily throw off shorter-term valuation measures like the traditional P/E ratio.
When the closing bell tolled on Sept. 26, the S&P 500's Shiller P/E was at 36.9. This more or less matches its high for the current bull market rally and is more than double the average reading of 17.16 when back-tested to January 1871.
What's more concerning is how stocks have reacted following the previous five instances where the S&P 500's Shiller P/E topped 30 during a bull market. Though there's no rhyme or reason to how long valuations can remain extended, the S&P 500, Dow Jones Industrial Average, and/or Nasdaq Composite have all eventually (key word!) lost between 20% and 89% of their value following these occurrences.
There have only been two other periods in 153 years — prior to the dot-com bubble bursting and late 2021/early 2022 — where stocks have been pricier than they are right now.
Although history doesn't repeat to a "T" on Wall Street, it often rhymes. No matter what happens on Nov. 5, current stock valuations should be the biggest concern for investors.
Post Metadata
- Post Number: 289
- Year: 2024
- Slug: this-is-why-i-am-concerned-about-the-stock-market
- Author: Alan
- Categories: Investing
- Subcategories: Shiller
- Tags: Shiller
- Keywords: Shiller
- Language Code: en
- Status: published
- Show On Homepage: 1
- Date Created: 9/30/2024
- Last Edited: 9/30/2024
- Date To Show: 9/30/2024
- Last Updated: 7/1/2025
- Views: 0
- Likes: 0
- Dislikes: 0
- Comments: 0